Product Introduction
Definition: GitCity is an open-source, browser-based data visualization platform and procedural 3D environment generator designed to transform GitHub contribution metadata into interactive, isometric architectural models. It functions as a specialized "Git-to-3D" renderer that parses public commit history to construct a digital skyline.
Core Value Proposition: GitCity addresses the need for engaging developer branding and gamified productivity tracking. By converting abstract contribution graphs into a tangible, driveable 3D city, it provides developers with a high-impact visual representation of their coding consistency, repository activity, and long-term commitment to open-source software. It serves as a unique tool for developer portfolio enhancement and social proofing within the tech ecosystem.
Main Features
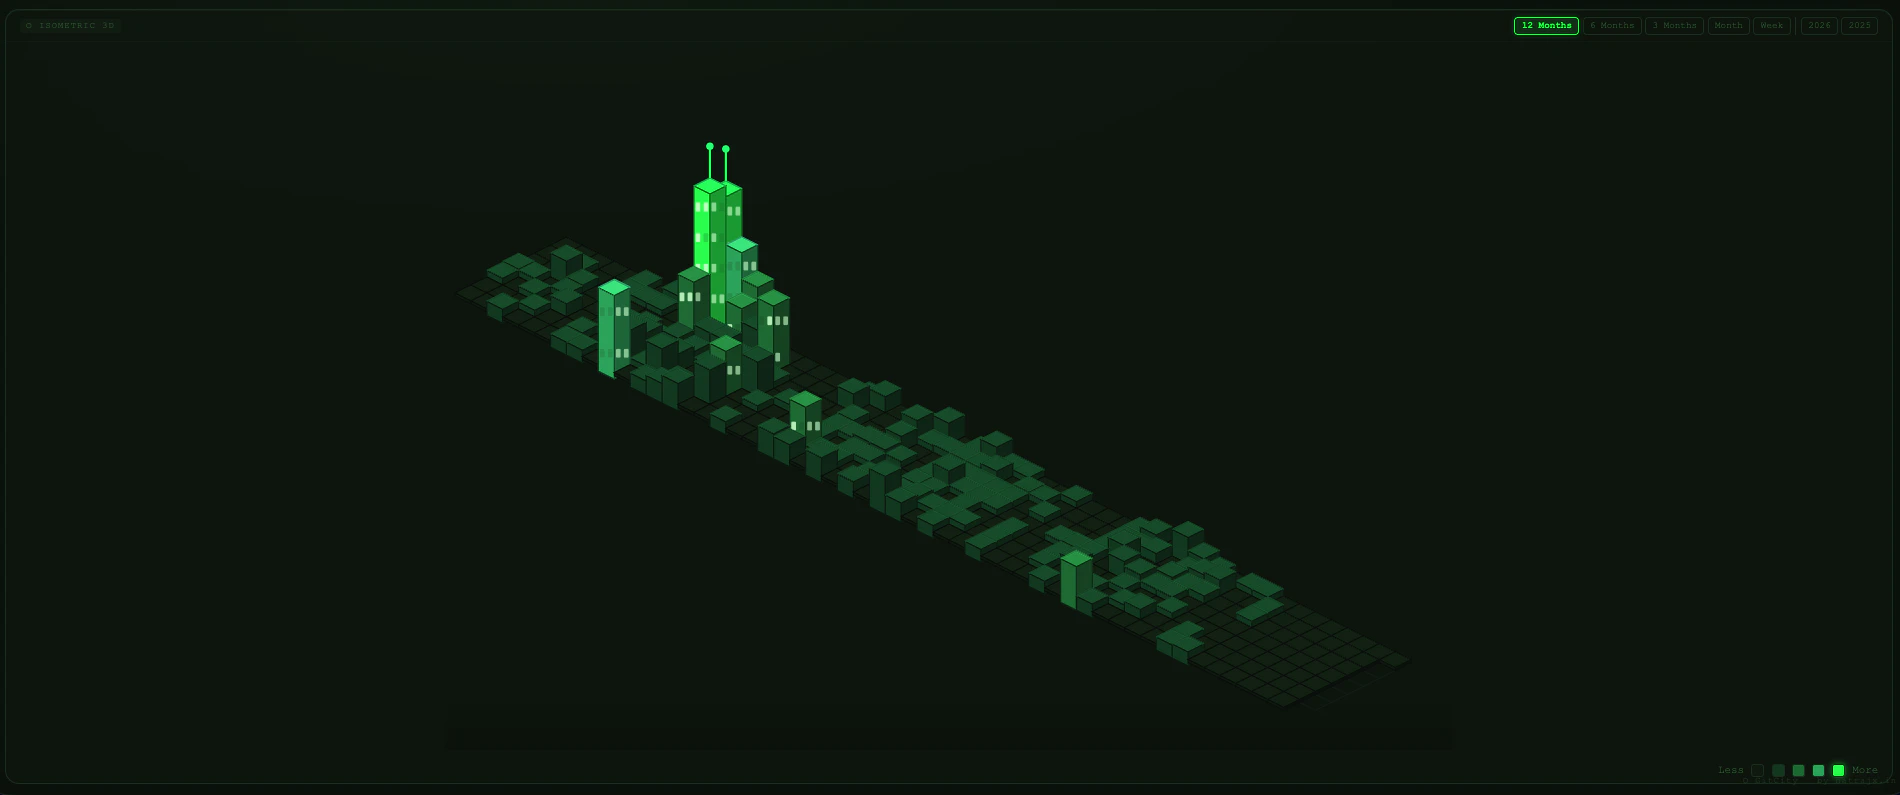
Isometric 3D Contribution Mapping: The core engine fetches public GitHub event data and maps commit density to building geometry. Each building's verticality and scale are procedurally generated based on the number of contributions made on specific days. This transforms the standard 2D contribution grid into a 3D landscape where "mountains" represent peak productivity periods.
Interactive Driveable Simulation Mode: Beyond static observation, GitCity features a physics-integrated simulation mode. Users can toggle a vehicle-control interface to navigate through their "code city" in a third-person perspective. This feature leverages WebGL and potentially Three.js or similar frameworks to provide real-time collision detection and movement within the procedurally generated urban layout.
Multi-Thematic Aesthetic Overlays: The platform offers six distinct visual styles—Matrix, Noir, Aurora, Ocean, Gold, and Ice. These themes adjust the global illumination, material shaders, and color palettes of the 3D environment, allowing developers to match their city’s look to their personal branding or IDE color schemes.
Dynamic README SVG Embedding: GitCity provides a lightweight, embeddable SVG export option specifically optimized for GitHub Profile READMEs. This allows users to showcase a stylized, 2D representation of their 3D city that updates dynamically to reflect recent activity, improving profile conversion rates for recruiters and collaborators.
Tokenless Public Data Fetching: The system utilizes the public GitHub API to retrieve data solely via usernames. By operating without OAuth login requirements or Personal Access Tokens (PATs), it ensures a zero-friction user experience while maintaining high standards of data privacy and security.
Problems Solved
Pain Point: Abstract/Stale Profile Stats: Traditional GitHub contribution graphs are often overlooked because they lack depth and interactivity. GitCity solves this by turning "green squares" into a memorable 3D experience that commands attention during technical screenings and portfolio reviews.
Target Audience:
- Software Engineers: Seeking to differentiate their personal portfolios.
- Open-Source Contributors: Looking for a visual reward for their public work.
- Technical Recruiters: Needing a quick, visual heuristic to gauge a candidate's consistency.
- DevOps Professionals: Who enjoy gamified representations of infrastructure and deployment cycles.
- Use Cases:
- Developer Portfolios: Integrating a unique 3D visual to demonstrate activity.
- GitHub Profile Customization: Using the SVG embed to replace standard, static contribution widgets.
- Social Media Sharing: Creating visually striking snapshots of a "year in code" for Twitter/X, LinkedIn, or Mastodon.
Unique Advantages
Differentiation: Unlike existing 3D contribution tools that require complex setups or local rendering, GitCity is entirely client-side and requires no login. It bridges the gap between a static data visualizer and a sandbox game, offering a level of interactivity (driving) that competitors lack.
Key Innovation: The specific innovation lies in the "zero-data-storage" architecture. By processing all data in real-time through public endpoints and not storing user metadata on a central server, GitCity provides a privacy-first approach to developer analytics while delivering high-fidelity 3D graphics directly in the browser.
Frequently Asked Questions (FAQ)
How do I add a GitCity 3D visualization to my GitHub README? To add GitCity to your profile, generate your city using your GitHub username, select the "README embed" option, and copy the provided SVG or Markdown snippet. Paste this code directly into your README.md file to display a dynamic snapshot of your 3D skyline.
Does GitCity require access to my private GitHub repositories? No. GitCity operates using public GitHub data only. It does not require you to log in with your account or provide a Personal Access Token. It is designed to visualize public contributions that are already visible on your public GitHub profile page.
Can I customize the buildings in my GitCity? Buildings are generated automatically based on your real-world commit history; taller buildings represent days with higher commit counts. However, you can customize the overall aesthetic by switching between the Matrix, Noir, Aurora, Ocean, Gold, and Ice themes to change the environment's lighting and textures.