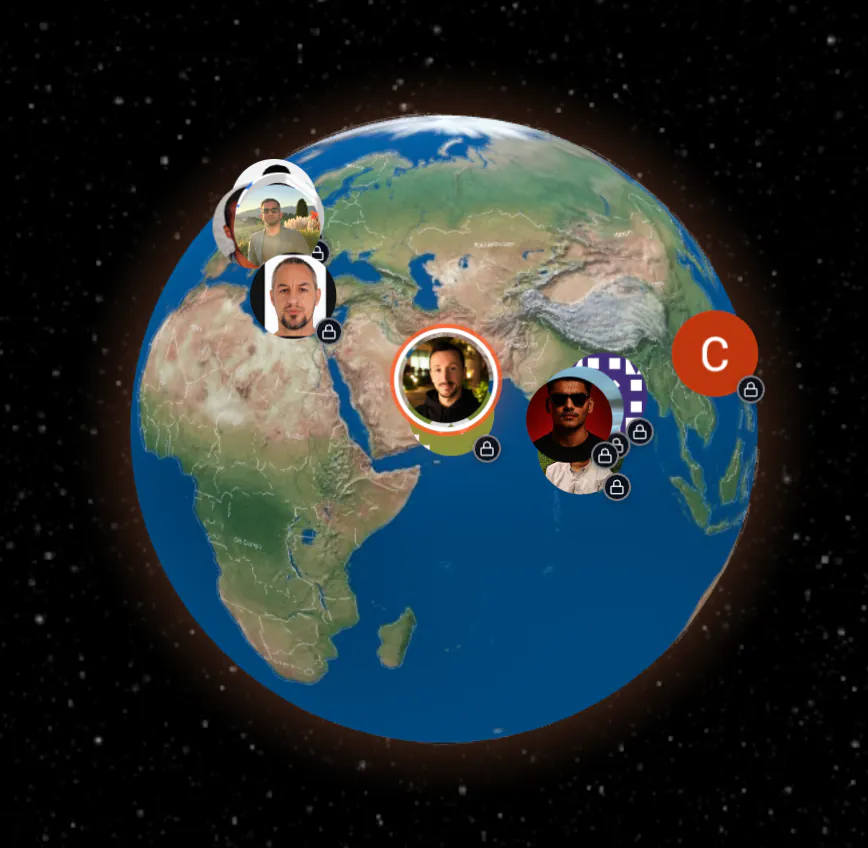
Product Introduction
- Definition: Dashi Metrics is a real-time business intelligence (BI) and analytics dashboard platform that visualizes user and revenue data on an interactive 3D globe. It falls under the technical categories of SaaS analytics, data visualization, and geospatial business intelligence.
- Core Value Proposition: It exists to replace static, chart-heavy dashboards with a dynamic, geographically mapped visualization tool. Its primary value is providing SaaS founders and teams with actionable, visual insights and real-time customer activity tracking on a global scale, making data exploration instantly engaging.
Main Features
- Interactive 3D Globe Visualization: The core interface is a WebGL or similar technology-powered 3D globe. It plots data points (visitors, payments) by their geographic origin in real-time. Users can spin, zoom, and click on data clusters for detailed breakdowns, transforming abstract numbers into a spatial context.
- Real-Time Data Streaming: The platform integrates with data sources (like payment processors Stripe or Paddle, and analytics tools via API) to stream events live. This enables live geographic visualizations where teams can watch customer activity and transactions happen across the world as they occur, without manual refresh.
- Dynamic Trend Mapping & Filtering: Beyond plotting points, the system aggregates data to show global trends and heat maps. Users can filter data by time range, event type (e.g., trial sign-up vs. payment), or customer segment, allowing the 3D visualization to instantly reflect specific queries for actionable insights.
Problems Solved
- Pain Point: It addresses the problem of static, boring dashboards that fail to engage teams and obscure geographic trends in user bases. Traditional charts (line, bar) are poor at intuitively showing spatial distribution and real-time movement.
- Target Audience: Primary user personas include SaaS founders, product managers, and growth marketing teams at companies with a global or distributed customer base. It's also suited for remote teams who need a shared, visually compelling view of business health.
- Use Cases: Essential for monitoring the geographic impact of a new feature launch or marketing campaign in real-time. Critical for SaaS companies to identify emerging markets, visualize customer concentration, and present company metrics to stakeholders in an engaging, memorable format.
Unique Advantages
- Differentiation: Unlike traditional BI tools (Tableau, Looker Studio) that rely on charts and graphs, or even map charts, Dashi Metrics uses a fully interactive 3D globe as its primary canvas. Compared to generic analytics dashboards, it prioritizes geographic visualization and real-time engagement over exhaustive, multi-tab reporting.
- Key Innovation: The specific innovation is the application of real-time data streaming to a manipulable 3D geospatial model for business metrics. This "lofi analytics" approach reduces cognitive load by making data exploration intuitive and visually stimulating, turning metric monitoring into an interactive experience.
Frequently Asked Questions (FAQ)
- What is Dashi Metrics used for? Dashi Metrics is used for visualizing and monitoring real-time business data, such as website visitors and customer payments, on an interactive 3D globe to gain geographic insights and track global trends for SaaS companies.
- How does Dashi Metrics get its data? Dashi Metrics integrates with your existing business tools via APIs, connecting to data sources like payment processors (e.g., Stripe), analytics platforms, and CRM systems to stream live event data directly onto its visualization globe.
- Is Dashi Metrics a replacement for Google Analytics? No, Dashi Metrics is not a direct replacement for Google Analytics. It is a complementary data visualization dashboard that focuses on geographic and real-time presentation of key business metrics, often using data aggregated from other analytics and payment tools.
- What are the benefits of a 3D globe for analytics? The benefits of a 3D globe analytics dashboard include intuitive understanding of customer geographic distribution, engaging visual presentation for teams, and the ability to instantly spot spatial patterns and market concentrations that are less obvious in traditional charts.
- Can I use Dashi Metrics for offline or historical data analysis? Yes, while emphasizing real-time data, Dashi Metrics typically allows users to filter by historical time ranges, enabling the interactive globe visualization to represent past data trends and customer activity for retrospective analysis.